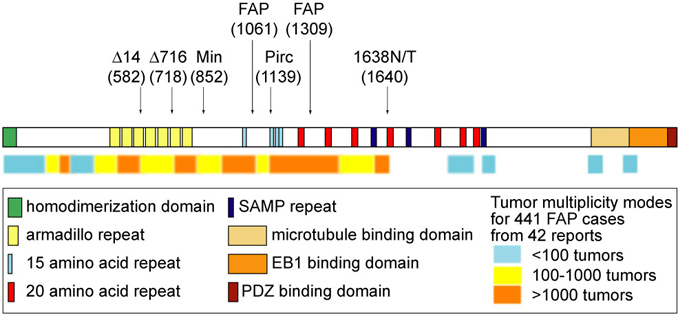
The structure of the Apc protein. Arrows indicate orthologous locations of mouse and rat model mutations and the most common FAP mutation sites. The color bar below indicates the genotype-phenotype correlation of sites of protein truncation to human disease severity. [Genotype-phenotype correlation data] [References]